A City Region Food System indicator framework
RUAF and FAO have developed a City Region Food System (CRFS) indicator framework in the context of their joint programme on CRFS assessment and planning. This framework is a practical tool designed to help cities to:
- assess, following a whole-system approach, the current status and performance of a city region food system;
- identify priority areas for action with clear desired outcomes and ways of measuring change;
- plan strategy and action to achieving desired outcomes; and
- establish baselines and monitor changes resulting from (future) policy and programme implementation.
Development process
The indicator framework has been developed around 21 key “desired direction of travel” areas that characterise a more sustainable and resilient CRFS (“A Vision for City Region Food Systems”, FAO & RUAF). Following initial work at two expert meetings organised in Rome (March 2015 and April 2016), a set of 210 indicators/measures was compiled to help measure both baseline data and ongoing progress towards these desired food system sustainability and resilience changes. The framework further builds on experiences from its application by local teams in seven cities on different continents.
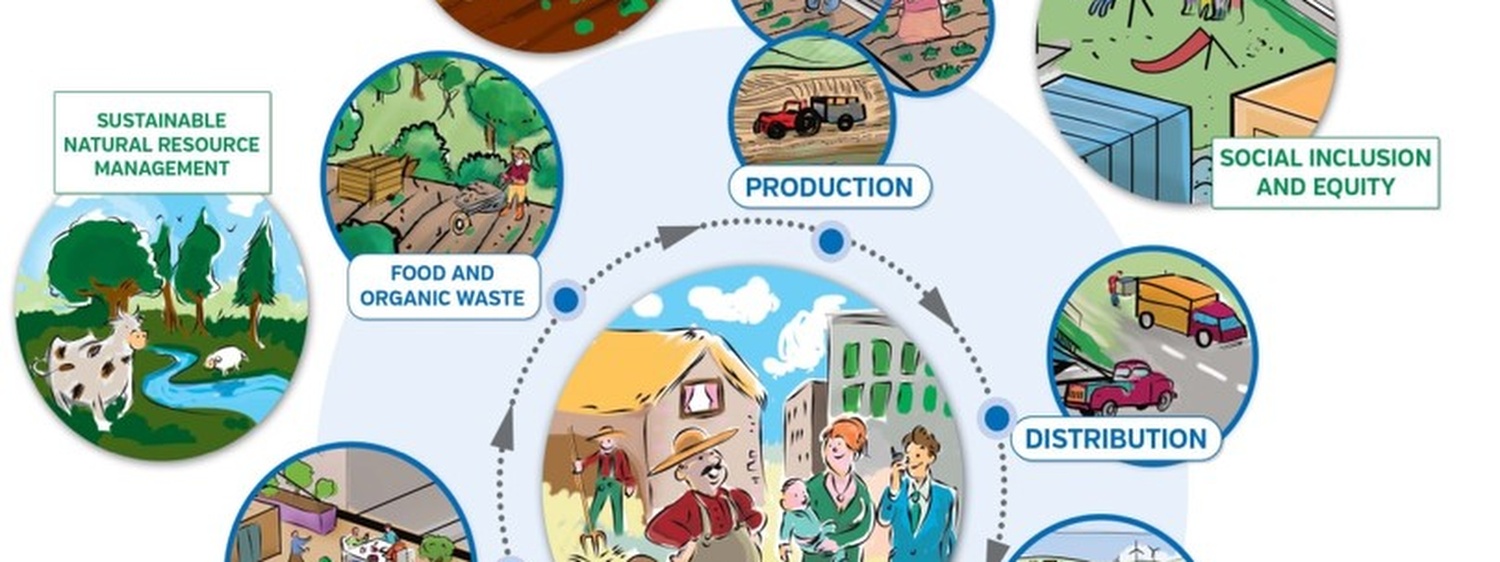
Taking a “whole food system” approach, the indicators are based on a matrix of food system dimensions:
- Those sustainability areas that reflect the multifunctional nature of the food system; and
- Food system outcomes for the different components of the whole food system (from production through to waste, and also food system policy and planning).
The indicator framework connects policy priorities to outcomes that cities may want to see in the future (i.e., changes that characterise a more resilient and sustainable CRFS) and defines possible indicators for each outcome. For each of the six food system sustainability areas, overarching objectives, outcomes and impact areas have been defined.
The 210 possible indicators included in the full CRFS indicator framework correspond to the different impact areas. The purpose of the indicators is to help measure the extent to which the desired changes are actually happening. Each city will need to identify the most appropriate indicators for their own priority impact areas. Indicators can also be used to establish a baseline from which to measure on-going progress/change over time.
There are two important points to note:
- Most of the indicators relate to the whole city region; they therefore include both rural and urban situations rather than specify them separately.
- Many of the indicators are in fact multiple indicators and will need to be disaggregated. The more the data can be disaggregated – e.g., by geographic location, income group, age category, gender – the better.
A number of indicators will require very specific data and may need breaking down into sections to calculate final figures; one example is, “(Decrease in) number and type of people requiring emergency food aid”. This process should be informative, even if a final figure proves too difficult to establish. Identifying where data is missing is in itself an important finding.
The indicator framework also includes a column with corresponding Sustainable Development Goals (SDGs) indicators that could be adapted to suit the local situation. This might be useful if a city is making use of SDGs in its own strategic plans. It also sets out suggested data sources, either secondary or primary, from which indicator information could be extracted or collected. This list is not comprehensive.
How to use the framework
- Getting started: As every city is different, the first step will be to identify food system change priorities that are informed by a deeper understanding of the local city and city-region context. The indicator framework sets out ideas for “desired direction of travel” and each city will have to decide on (more) specific objectives for attaining sustainable and resilient city region food systems, which may need to align with already set policy objectives.
- Using the indicators: Indicators need to be selected according to priorities and modified to suit the local situation. They can be used to help guide and build initial baseline data. The indicators are only numbers and ultimately need to be connected to their relevant “impact area” and “desired direction of travel” through (early stage) analytical narrative. It should also be noted that the extent to which local organisations/researchers in cities can collect/analyse corresponding data is largely dependent on data availability (secondary and primary data) and on the complexity of the indicators. Challenges will include agreeing on what to measure; finding inexpensive ways to collect data and gaining insights into what it means; engaging decision/policy makers or budget holders in prioritising this work; and aligning this work with available resources: money, time, expertise, commitment.
- Data collection: Collection and analysis of data on selected CRFS indicators can be accomplished using a variety of methods, including:
- qualitative and quantitative data collection by means of household, government and business surveys;
- further stakeholder and expert consultations (focus group discussions, interviews, etc.);
- quantitative food flow mapping; and
- use of representative case studies to illustrate specific issues, highlight (potential) innovations and provide more specific inputs /ideas for policy and action planning.
- Spatial location of data: It will be important to be able to geographically link specific indicator data collection and analysis to specific areas in the city as a basis for further territorial planning.
- Gender dimension: The further development of CRFS indicators should take into account different sustainability dimensions including gender, urban resilience and youth employment. With support of the CGIAR Water, Land and Ecosystems Research Program (WLE), RUAF, IWMI and CIAT will apply a specific gender lens to further development of the framework and the development of methodological guidelines on data collection and analysis.
Conclusion
The final goal of a CRFS analysis and indicator/data collection is to advance CRFS policy design or strategy planning. Collection of baseline indicators may act as a useful trigger for improved action and policy; the “neutral” appearance of data and research presented provides an entry point for food to be considered on the policy agenda. As well, indicators can play a useful role in order to allow for monitoring and improving performance and progress in terms of programme and policy implementation.
For example, from the Utrecht region (the Netherlands) perspective, there is a gap in the production of regional vegetables, meat and eggs. Fruit and dairy production is more locally present and provides opportunities for a regional market. One of the policy recommendations is to better match local supply and demand. This requires enhancing demand for local food, support to regional production, processing and marketing, and improved coordination between urban food demand and supply of regional food products from farm businesses located in surrounding municipalities. Relevant indicators include:
- Number of farm businesses in the Utrecht region, by type, that produce explicitly for the Utrecht region;
- Number of farmers’ markets in the Utrecht region;
- Percentage of the population in Utrecht that always/often buys regional food products; and
- Proportion of food procurement expenditure by public institutions on food from shorter (local/regional) supply chains.
In Quito (Ecuador), targets were set for the different envisaged outcomes of the territorial food strategy. (Baseline) indicators were defined for each of the targets, including:
- Types of food products and volumes imported (from outside the city region) compared with similar types of product volumes produced in the city region;
- Total surface area of current and potentially available currently vacant land within the Metropolitan District of Quito used for urban and periurban and rural agriculture land;
- Number and percentage of children suffering from chronic malnutrition (per income group);
- Presence of an active multi-stakeholder food policy and planning structure;
- Existence of a food supply emergency/food resilience management plan for the municipality (in response to disasters; vulnerabilities in food production, transport, access; socio-economic shocks, etc.) based on vulnerability assessment;
- Costs of a nutritious food basket at city/community level; and number of jobs in the food sector.
For policy outreach and planning purposes, it is important to consider the presentation and visualisation of data collected and how these findings are communicated with policymakers.
In Colombo (Sri Lanka), Kitwe and Lusaka (Zambia), data collected in the assessments were georeferenced and mapped to better visualise and understand the CRFS and its spatial distribution and dynamics. In Utrecht and in Toronto (Canada), key data and figures were summarised and visualised for different parts of the food system, for example to bring to the forefront key food system contributions to job creation, GHG emissions or health impacts.
Milan Urban Food Policy Pact Monitoring Framework Indicators
During 2017-2018 RUAF has worked with FAO to develop a shorter set of indicators specifically for the MUFPP city signatories. The MUFPP indicator framework has been developed from the longer CRFS indicator framework but is specifically focused on the city and the urban food system, and tailored to align with local government urban policy priorities and data availability. There is a set of indicators for each of the six pact action categories, and detailed user guidelines for each of the 44 indicators. 14 cities participated in refinement of these indicators; 3 cities have started to use them and in the coming year more selected cities will pilot the indicator framework supported by a series of webinars.
- PowerPoint developed for Milan Urban Food Policy Pact 4th Annual Gathering Mayors Summit Tel Aviv Sep 2018. The monitoring framework: progress so far. Guido Santini (FAO) and Joy Carey (RUAF)
Milan Urban Food Policy Pact (MUFPP) Monitoring Framework Handbook and Resource Pack
In July, 2021, RUAF, FAO and the MUFPP Secretariat launched the The Milan Urban Food Policy Pact (MUFPP) Monitoring Framework Handbook and Resource Pack. ‘Designed for cities by cities’, this handbook helps cities to track the impacts of their food system policies and strategies. It provides practical steps, simple tools, top tips and a methodology for any cities wishing to adopt and implement a monitoring framework, tailored to their own context and reflecting MUFPP recommendations.
The MUFPP Monitoring Framework Handbook is based on the results and lessons learned from a seven-month project in 2019 during which three cities – Antananarivo (Madagascar), Nairobi (Kenya) and Quito (Ecuador) – piloted the implementation of the MUFPP Monitoring Framework with technical support from RUAF and FAO.
- The Handbook and Resource Pack can be downloaded at: http://www.fao.org/documents/card/en/c/cb4181en/
- PDF version: http://www.fao.org/3/cb4181en/cb4181en.pdf
- 2-page flyer: https://ruaf.org/assets/2021/07/2pp-flyer_MUFPP-Handbook-and-Resource-pack_Final.pdf
- RUAF website (section news): https://ruaf.org/news/new-publication-the-milan-urban-food-policy-pact-monitoring-framework-handbook-and-resource-pack/
- RUAF website (section resources): https://ruaf.org/resource/milan-urban-food-policy-pact-mufpp-monitoring-framework-handbook-and-resource-pack/
Funding
This CRFS Indicator Framework is part of the CRFS toolkit to assess and plan sustainable city region food systems. The toolkit has been developed by FAO, RUAF Foundation and Wilfrid Laurier University with the financial support of the German Federal Ministry of Food and Agriculture and the Daniel and Nina Carasso Foundation.